Turning Hargapedia's price list into a price meter
I tried four designs for Hargapedia's new price meter, and building the one we picked turned out to be one of the more complex UIs I've done in React Native.
For years, Hargapedia’s product page used a horizontal bar to show where a product’s current price sat between the lowest and highest prices we’d recorded. The usual price was marked somewhere in between, and below it was a list of shops selling the product.
That bar had been around since 2018. We’d redesigned it a few times, and I’d even tried making it vertical back in 2021, but the price list itself had always remained separate.
In January, we changed that.
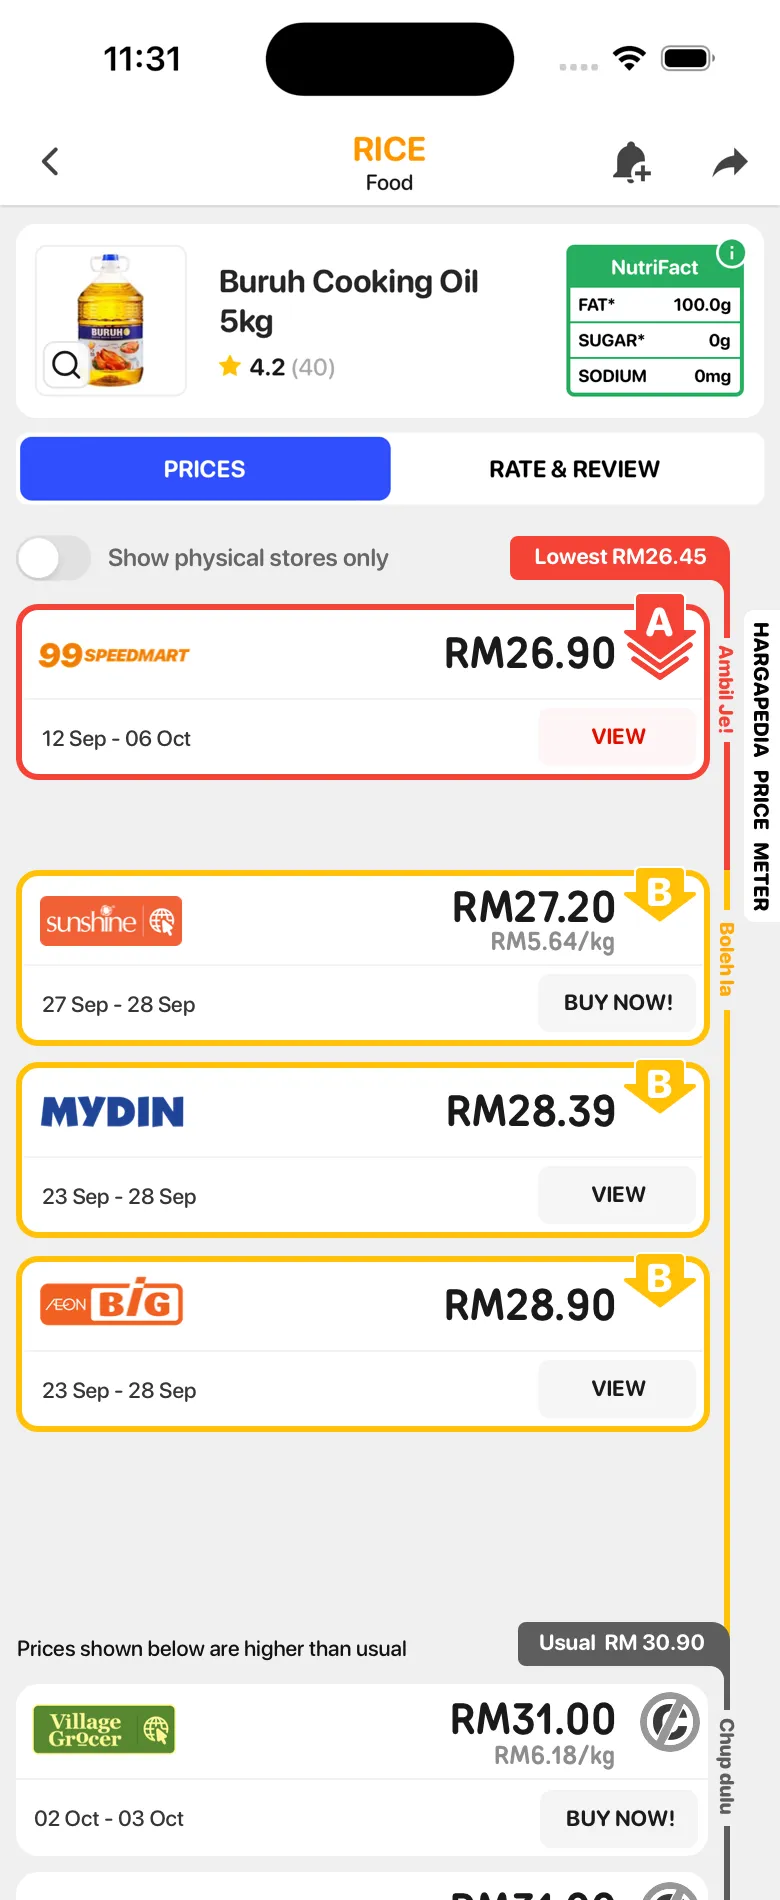
The bar is gone, and each price now gets an A, B or C grade to help people decide whether it’s worth buying. Instead of putting a graph above the prices, the whole list runs alongside a vertical meter, with the cheapest prices at the top, the more expensive ones below, and the usual price marked along the way.
I designed the new product page and built the meter in React Native. Drawing it in Sketch was fairly straightforward, since I could arrange the cards and make the ruler fit. Getting it to work in the app was another matter, because the number of prices, the height of each card and even the gaps between them can change.
Giving prices a grade
The release notes called them “ABC ratings to help you make better buying decisions”, but they’re different from the star ratings people give products in Rate & Review. They’re grades based on how good a price is, rather than what someone thinks of the product.
We gave each grade a Manglish name.
A is Ambil Je! (just take it), for a price that’s as low as we’ve seen in the last few months. B is Boleh la (it’ll do), for a price that’s still reasonably close to the lowest. C is Chup dulu (hold on), for prices that are higher than we’d recommend paying.
The app explains them a little more casually. A tells you it’s the cheapest in the last three months and you should buy now. B suggests it’s a good price if you’re running low on stock. C tells you the price is higher than usual, but leaves the decision to you.
The Manglish names stay the same in English, Malay and Chinese. Only the explanations are translated.
 A, Ambil Je!
 B, Boleh la
 C, Chup dulu
The grading takes into account the other prices available today and the lowest price we’ve recorded over the past few months. Today’s cheapest price gets an A if it’s also at or below that recorded lowest, and prices within 10 sen of it get an A too. Prices still close to the lowest receive a B, while those further up get a C.
The usual price is calculated separately. It’s the price we’ve recorded most often, and it becomes one of the markers on the meter.
With the grades in place, the next question was how to show them alongside the prices.
Four versions of the same idea
I’d tried vertical versions of the old price graph back in 2021, but none made it past the mockups. This time, the idea was different. Rather than turning the horizontal bar on its side, the entire price list would become part of the visualisation.
Last October, I put together four versions of the new product page in Sketch.
The first kept the price cards close together, much like the old list. A thick ruler ran alongside them, divided into red, yellow and grey sections for the different grades.
The other three introduced gaps between groups of prices. The idea was to give the spacing some meaning. If the cheapest B price was much lower than the usual price, for example, the space between them would be larger.
The second design kept the thick ruler, while the third added tick marks along it. The fourth went in another direction, replacing the ruler with a thin coloured line and putting the grade names beside it.
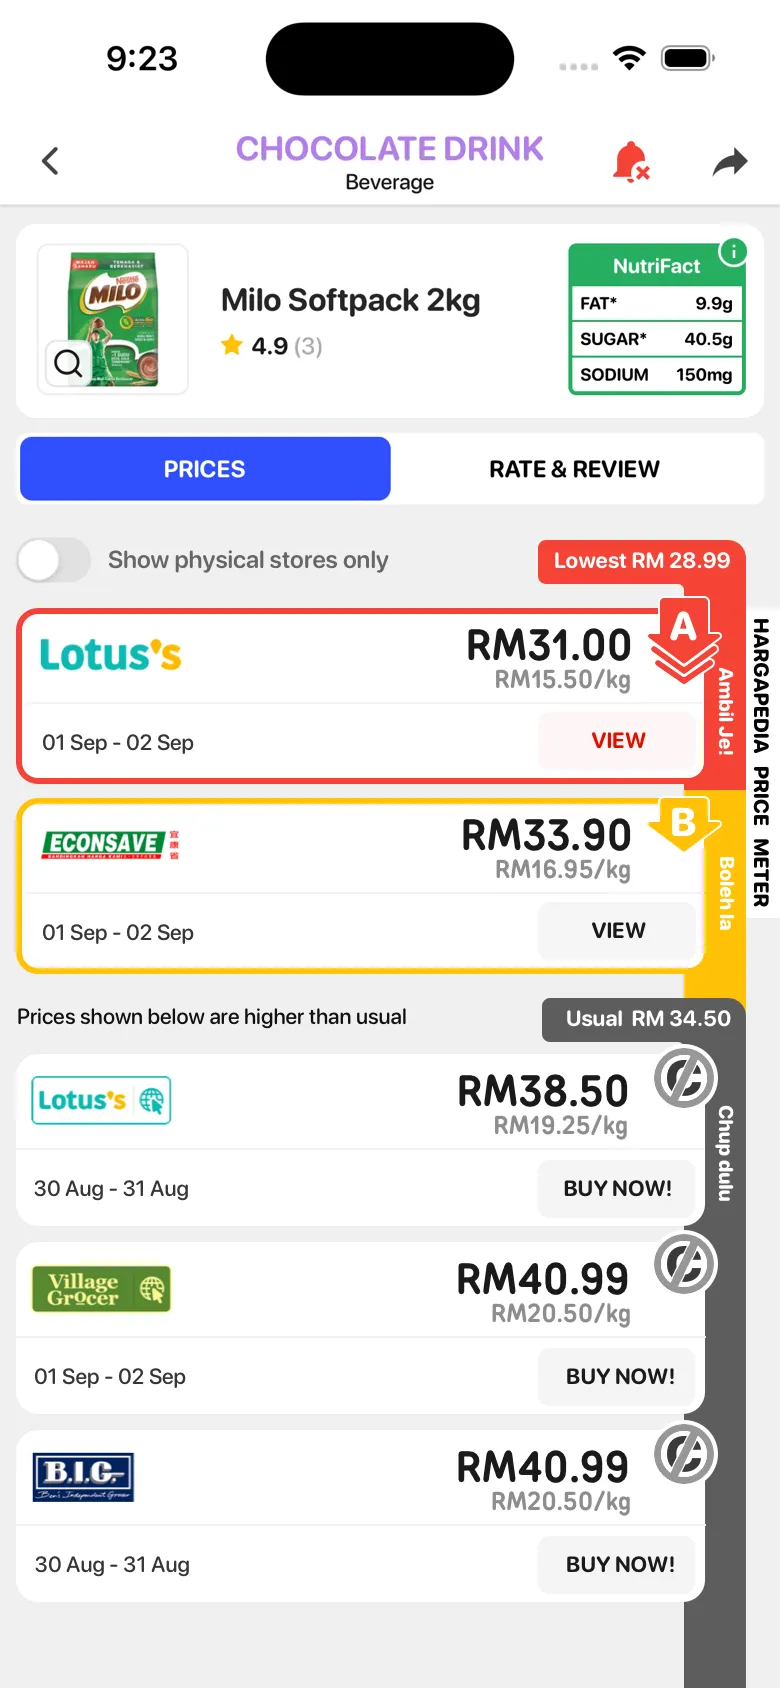
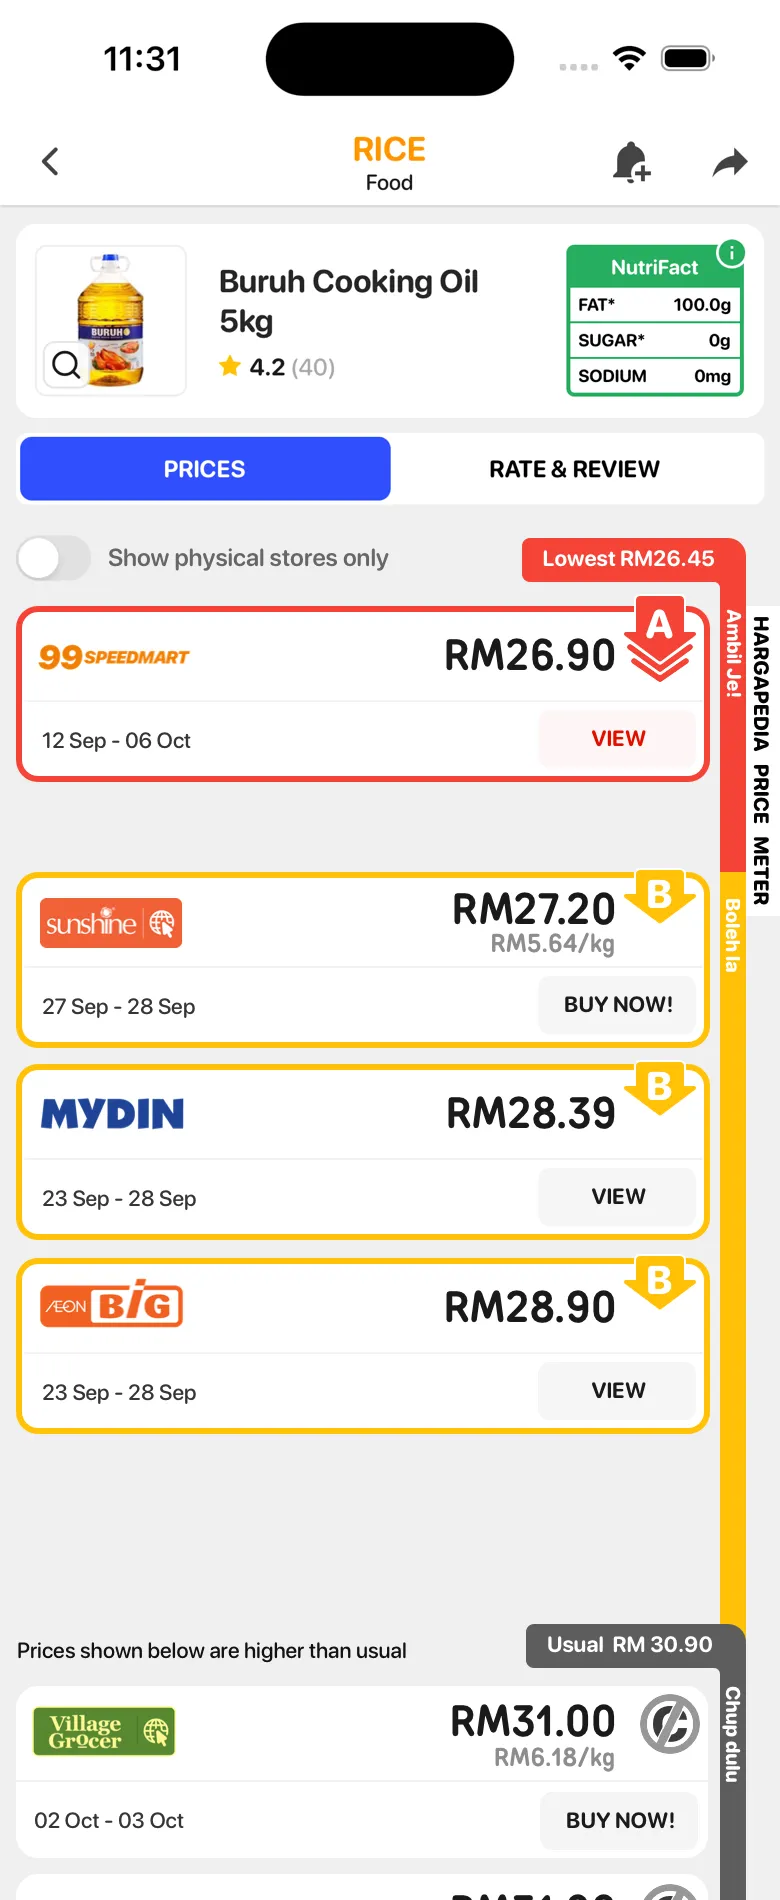
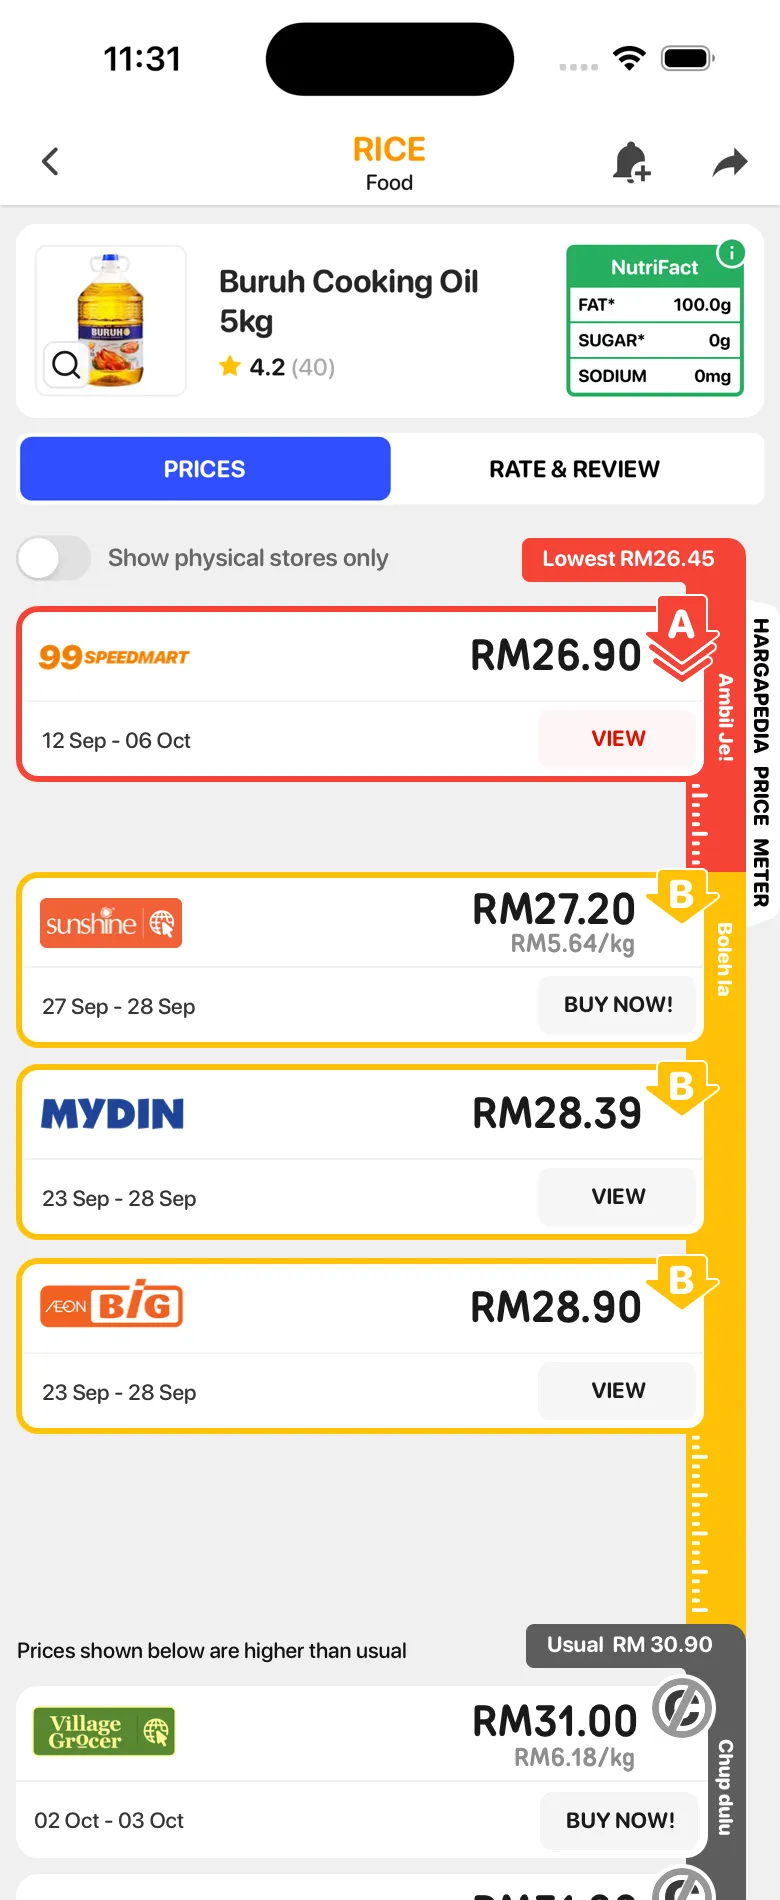
We settled on the third design, with the thick ruler and tick marks.
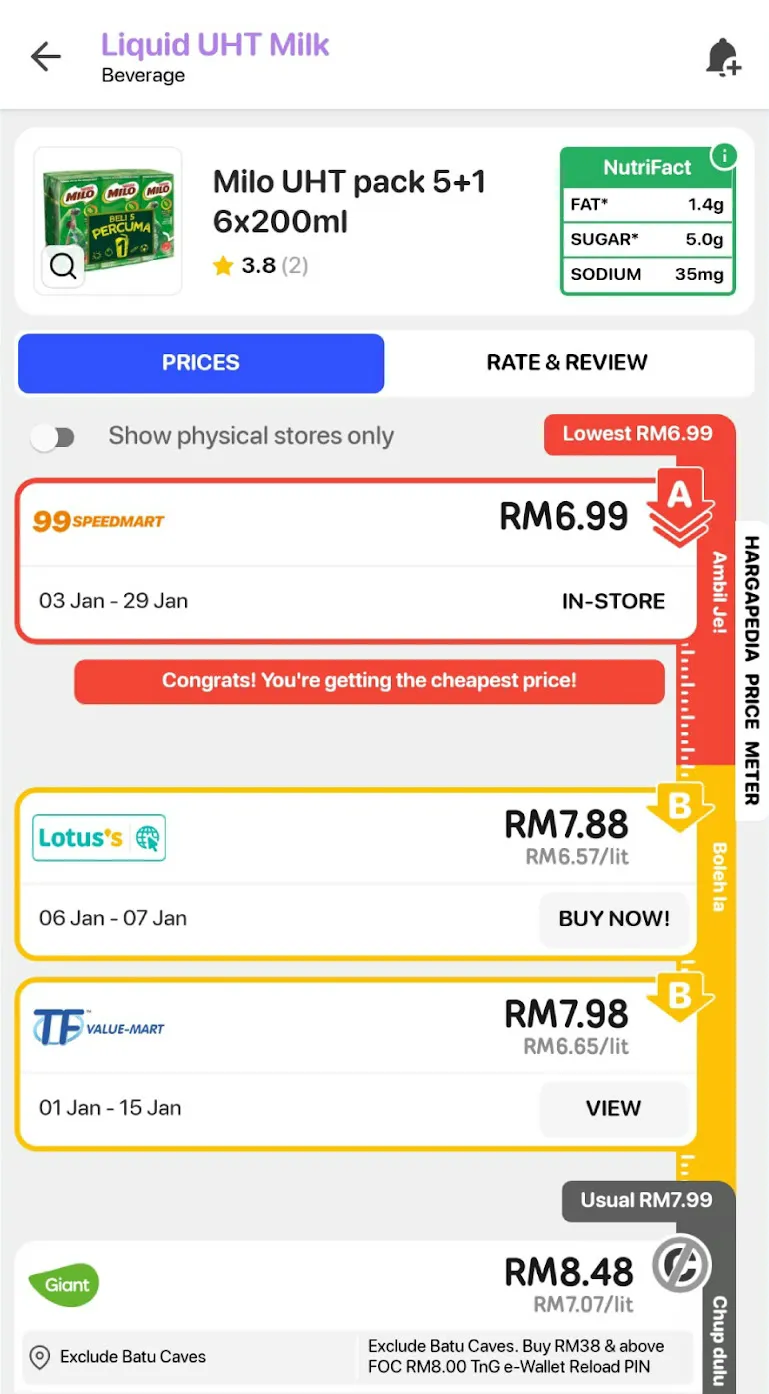
A few things changed between the mockups and the release.
There was originally a note beside the usual price saying that the prices below it were higher than usual. We removed that, and instead added messages in the gaps between price groups.
When there’s an A price and the next price is sufficiently far away, the gap gets a “Congrats! You’re getting the cheapest price!” message. If there’s no A, a sufficiently large gap after the B group can show “Boleh la, but the price difference could get you a coffee!”
I’d also tried labelling the gaps with their actual price differences, such as +RM0.30 between an A and the next B. That didn’t make it into the app. The difference is shown through the spacing instead.
Which brought me to the harder part: making that spacing work when the list is built from real data.
A ruler that has to follow the list
The old horizontal bar was simple in one respect. It had a fixed width, so the lowest, usual and highest price labels could be placed at positions calculated along that width.
The new meter doesn’t have a fixed length. It has to follow the price cards beside it.
That length depends on how many retailers are selling a product, and the cards aren’t necessarily the same height. Some have promotion notes that make them taller. There’s also a “Show physical stores only” switch, which removes online prices from the list.
I couldn’t simply give the ruler a height and position the labels at fixed percentages.
Instead, I built it around the list.
The prices are divided into A, B and C groups, and each group reports its height after React Native has laid it out. Those measurements determine where the different sections of the ruler begin.
The yellow section starts alongside the B group. The Usual label sits at the end of that group, with the grey section beginning just below it.
Rather than draw each coloured section at an exact height, I only give it a starting position. Each section extends down to the bottom of the meter, and the next colour is drawn over it. Yellow covers the red below the A group, and grey covers the yellow below the usual price.
The tick marks are even simpler. They’re a small image repeated down the ruler. Most of them are hidden behind the price cards, leaving only the ones in the gaps visible.
The gaps have their own calculation.
I take the difference in price between two groups, divide it by the full range from the lowest to the highest price, and multiply that by 50 points. A difference covering the entire range would therefore produce a 50-point gap.
But small price differences could leave almost no space at all, so I set a minimum of 20 points.
That gives the meter room to separate the groups even when their prices are close, while larger differences create visibly bigger gaps.
The messages I mentioned earlier depend on those gaps too. The congratulations message only appears when the gap after the A group is larger than the minimum. The coffee message follows the same rule for B, but only when there’s no A.
If every price is a C, the Ambil Je! label disappears from the ruler altogether, and the list begins with “No good prices now, but you can still get it!”
Filtering makes all of this a little more involved. When someone switches on “Show physical stores only”, the online prices disappear, which can change the number of cards in each group and their total heights.
The groups are rebuilt, their measurements reset to zero, and the ruler waits for the new layout measurements before positioning its sections again.
Keeping the labels where you can see them
Two parts of the meter needed to behave differently from the price list itself.
The first was the HARGAPEDIA PRICE METER title running vertically along the right edge.
I wanted that title to remain in place while people scrolled through the prices, so it isn’t part of the scroll view at all. It sits outside it, with the prices and ruler moving past.
The Usual price label was a little trickier.
On a product with a long list of prices, the real Usual marker might be several screens down. Without scrolling, you wouldn’t see where the usual price sits.
To handle that, I added a second copy of the label that waits at the bottom of the screen. As you scroll towards the actual marker, the copy fades away when the two meet.
That meant I needed to know where the real label was in relation to the screen.
I use React Native’s measure() to get its position, first when the page opens and then a few more times over the next second. Reanimated handles the fade based on the scroll position.
It gives the reader a reference to the usual price until the actual marker comes into view.
There was also a small change to the text on the ruler. The grade names and the meter title were originally rotated text, but shortly before launch, while we were moving to React Native 0.76, I replaced them with images.
Since the grade names are the same in all three languages, one set of images works for English, Malay and Chinese.
When the prices don’t fit neatly
Not every product has enough price history for a meter.
For a newly added product, the lowest and highest recorded prices can be exactly the same. That leaves no range to work with, so the page shows the prices without a meter and explains that there isn’t enough data yet.
There’s also a detail carried over from the old price graph. If a retailer is selling below the lowest price we’ve previously recorded, that retailer’s price becomes the lowest value shown at the top.
Multi-packs present a different problem.
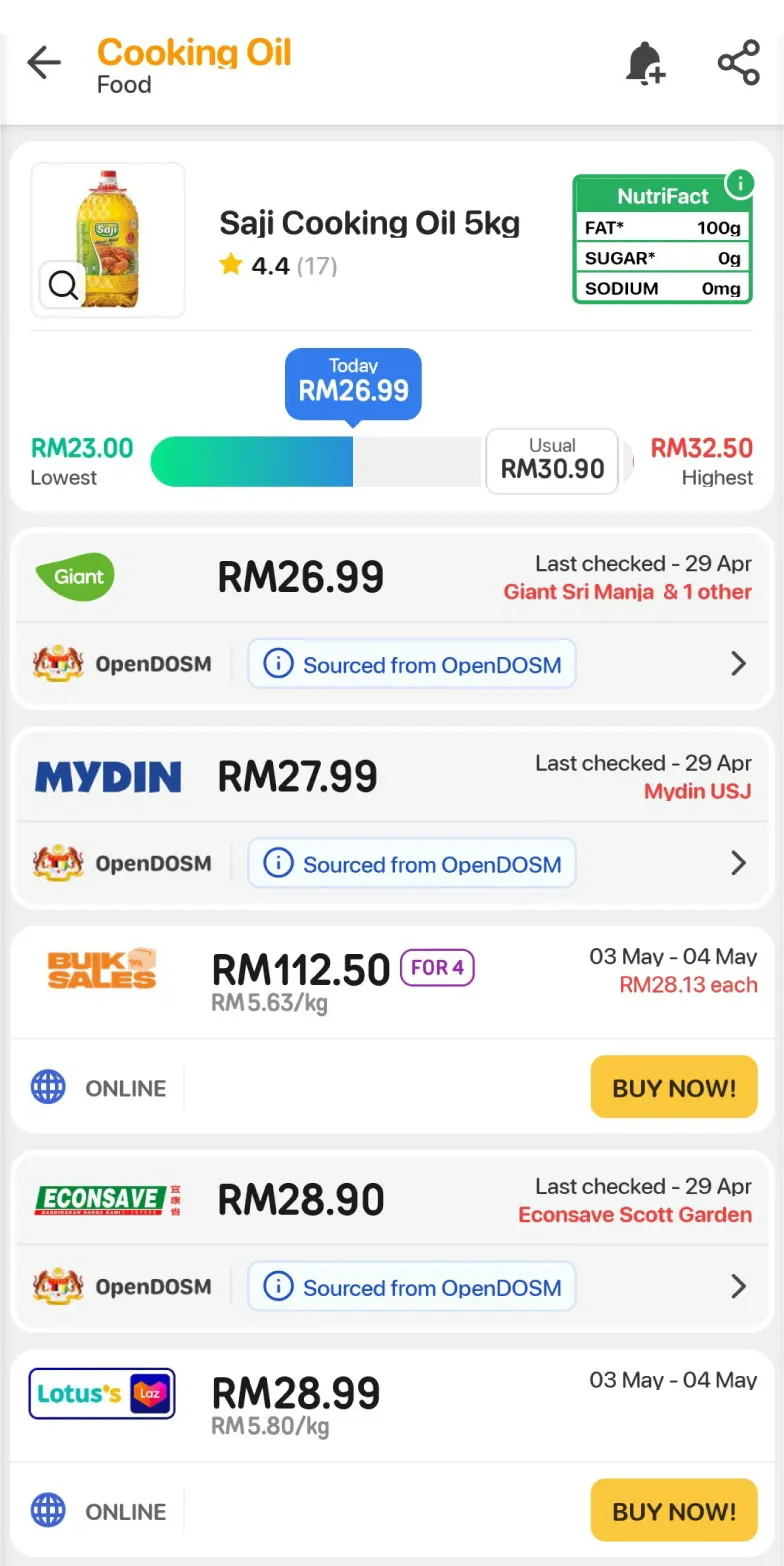
Take the Saji Cooking Oil example from the beginning of the article. Bulk Sales sells four bottles for RM112.50, which works out to RM28.13 each.
That offer sits between single bottles selling for RM27.99 and RM28.90, because we compare them using their per-item prices.
The meter follows the same logic. A multi-pack is ordered, graded and spaced according to the price per item, even though the card displays the total price in large text.
So you can have a card showing RM112.50 sitting among cards showing prices below RM30, with a grade that doesn’t immediately seem to match the big number.
In the January release, the per-item price appeared further down the card in a grey row, styled much like a promotion note.
This week’s update moves it into a dark pill directly beneath the total, aligned to the right just before the grade badge.
It’s a small change to the card, but it makes it easier to see why a pack of four has been given the same grade as a single item at a similar price.
The card on the home screen
The grades also appear on the home screen, on a Price Meter card that shows how many A and B deals each of your shops has at the moment.
The shops come from the postcode you give during setup. Their logos run across the card in a strip, sorted by how many A deals they have, and tapping one loads its deals underneath: up to nine products in three columns that scroll sideways, each with its grade badge. Show all opens the full list.
The A and B tabs down the left carry the counts. When you switch between them, the active tab grows and darkens while the other shrinks back, and the count rolls up to its number rather than appearing all at once. The ruler across the top is the same tick-mark image as the product page, repeated.
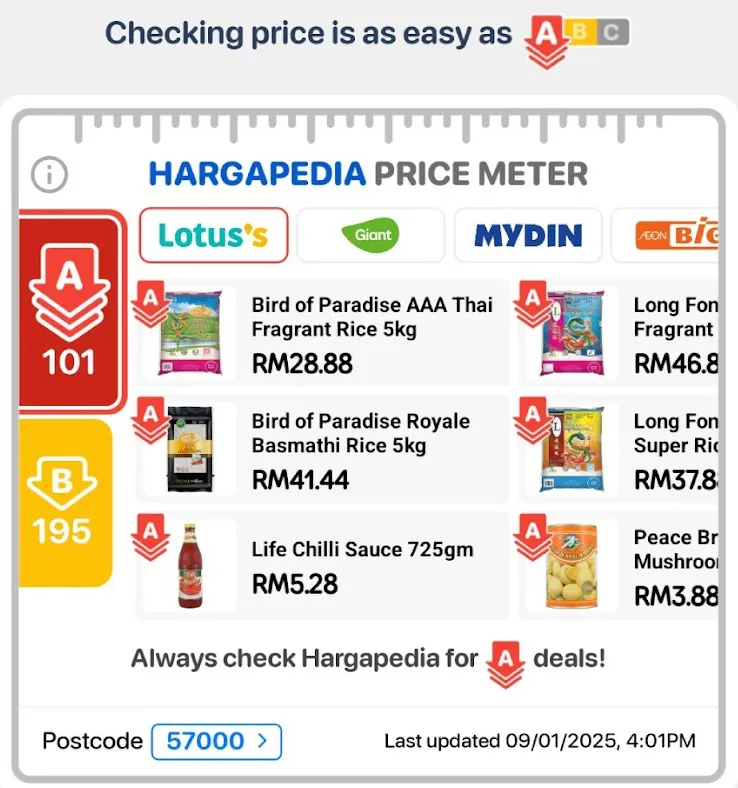
It was also quite a complex UI to build. The tabs, the logo strip and the grid all react to one another, and the card fetches a different set of products for each shop and grade.
The meter started as a fairly simple-looking ruler beside the price list. Making it follow the cards, respond to filters, keep important labels visible and handle different ways of pricing products turned out to involve quite a bit more work.
It’s one of the more complex interfaces I’ve built in React Native, and one I enjoyed working on.