Why we built Hargapedia's product ratings without an open review box
Hargapedia combines star ratings with sentiments users pick from lists set up by our marketing team, so there's no open text box to moderate.
Since Hargapedia launched in 2018, the product page has mostly been about prices. Open a product and you can see where it’s cheapest, what it usually costs and how prices have changed over time.
What you couldn’t see was whether people thought the product was any good.
Over the past few months, we’ve been working on a rating system to collect that feedback. We wanted people to rate different aspects of a product and describe what they liked or disliked, but without giving everyone a text box to write in. That would mean having to deal with public reviews and moderation, which we wanted to avoid.
We ended up combining star ratings with predefined sentiments, both configured by our marketing team for each product category.
Ratings and sentiments, without a text box
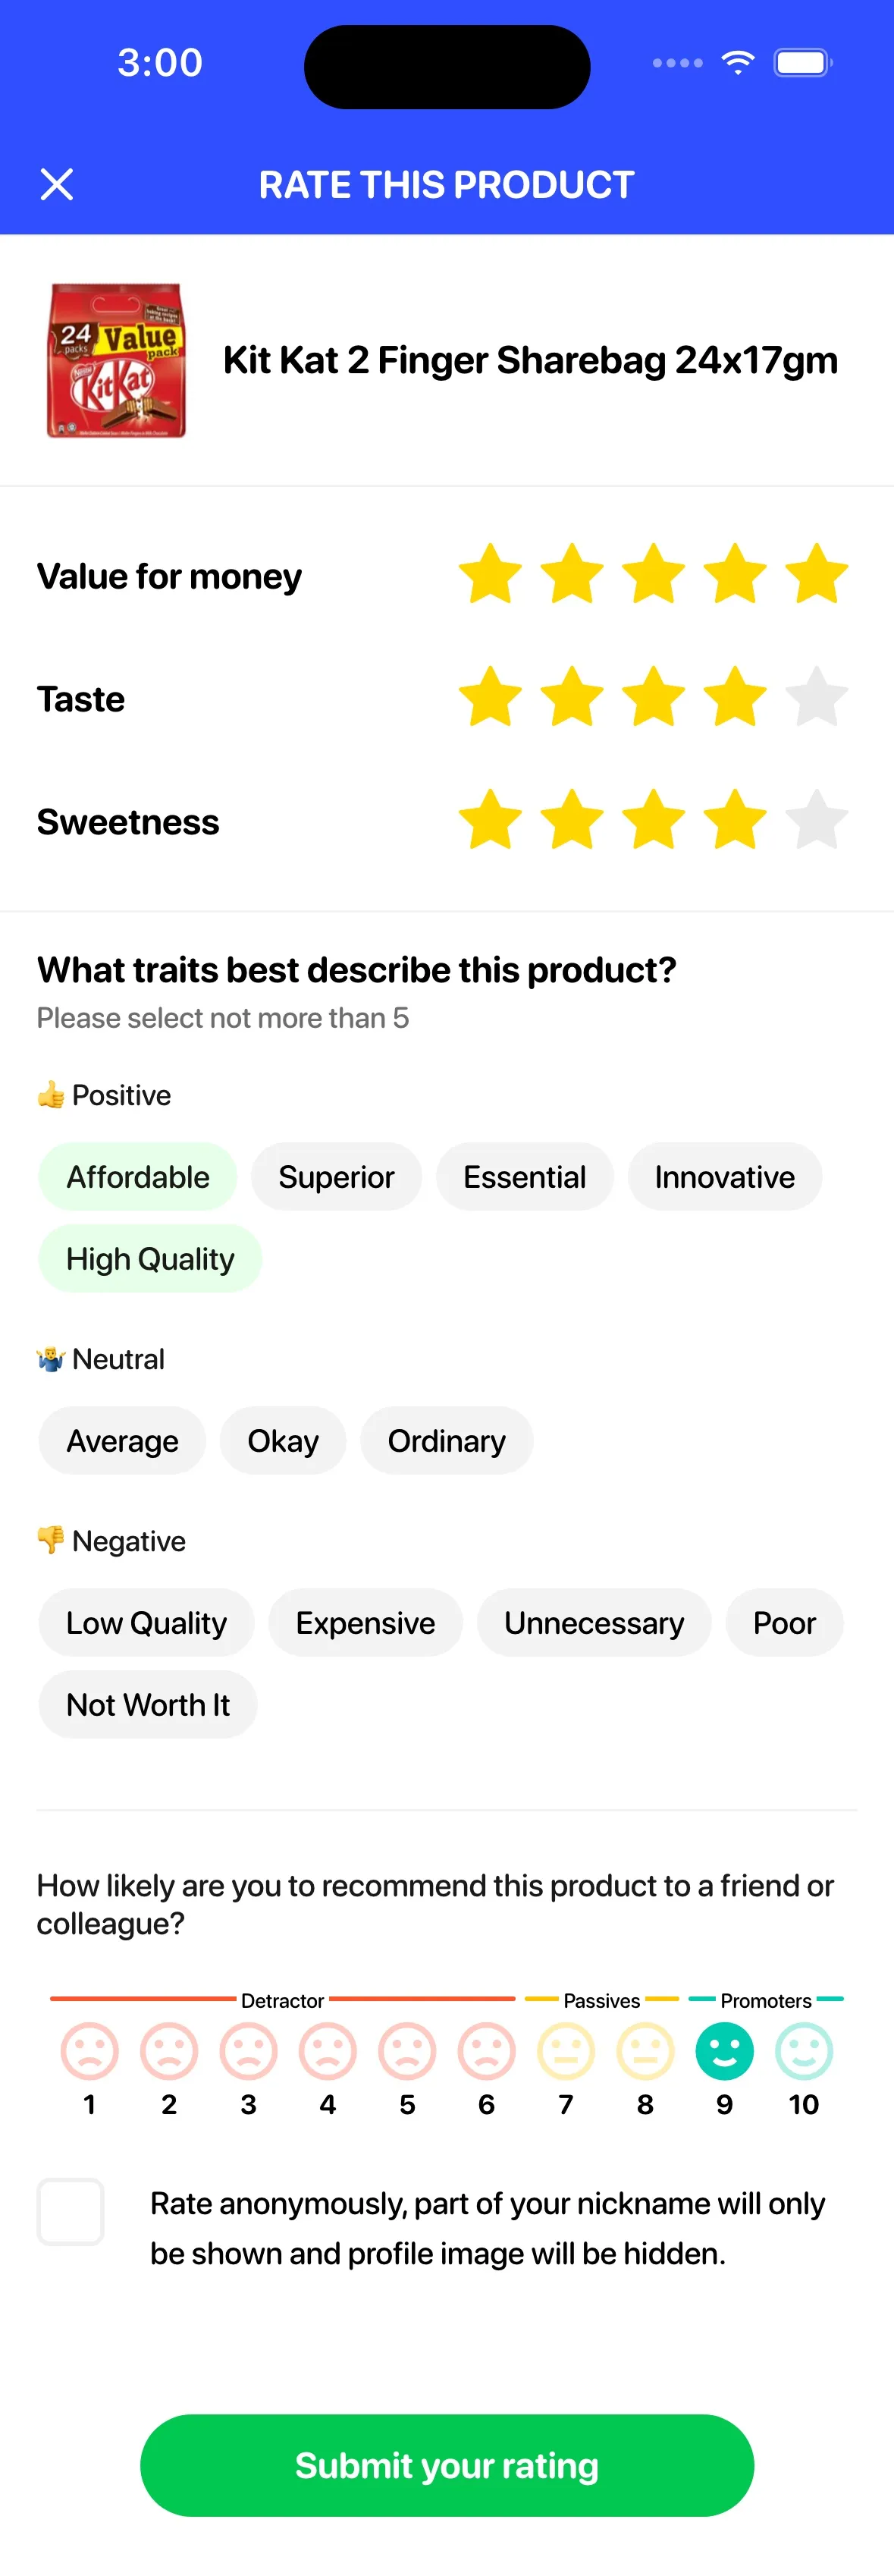
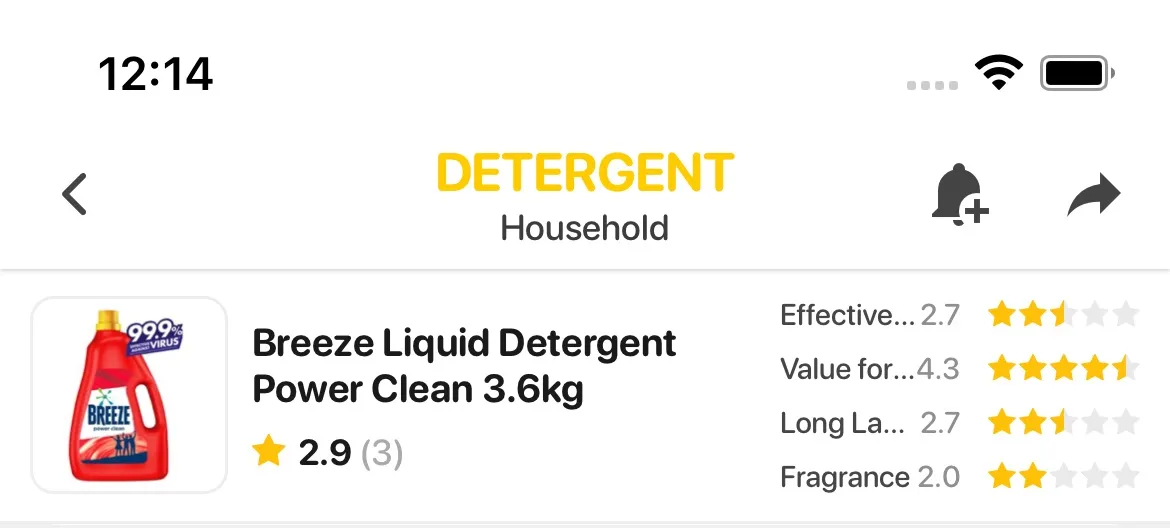
The aspects you rate depend on the category. For some products that’s price, quality and value. A detergent gets rated on how well it cleans, value for money, how long it lasts and its fragrance. The sentiments are words you can pick to describe the product.
To rate a product you have to be signed in. You give stars for each of those, then pick up to five sentiments from the category’s list, grouped into positive, neutral and negative, and the submit button only works once you’ve done both. If you’d rather not show who you are, you can rate anonymously. We swap your profile picture for a default one and show only part of your nickname, with the rest starred out.
Because the sentiments come from a list, they can be translated ahead of time, so each one has an English, a Malay and a Chinese version. If someone rates a product in Chinese and you use the app in English, you see their chosen sentiments in English.
What shows up on the product page
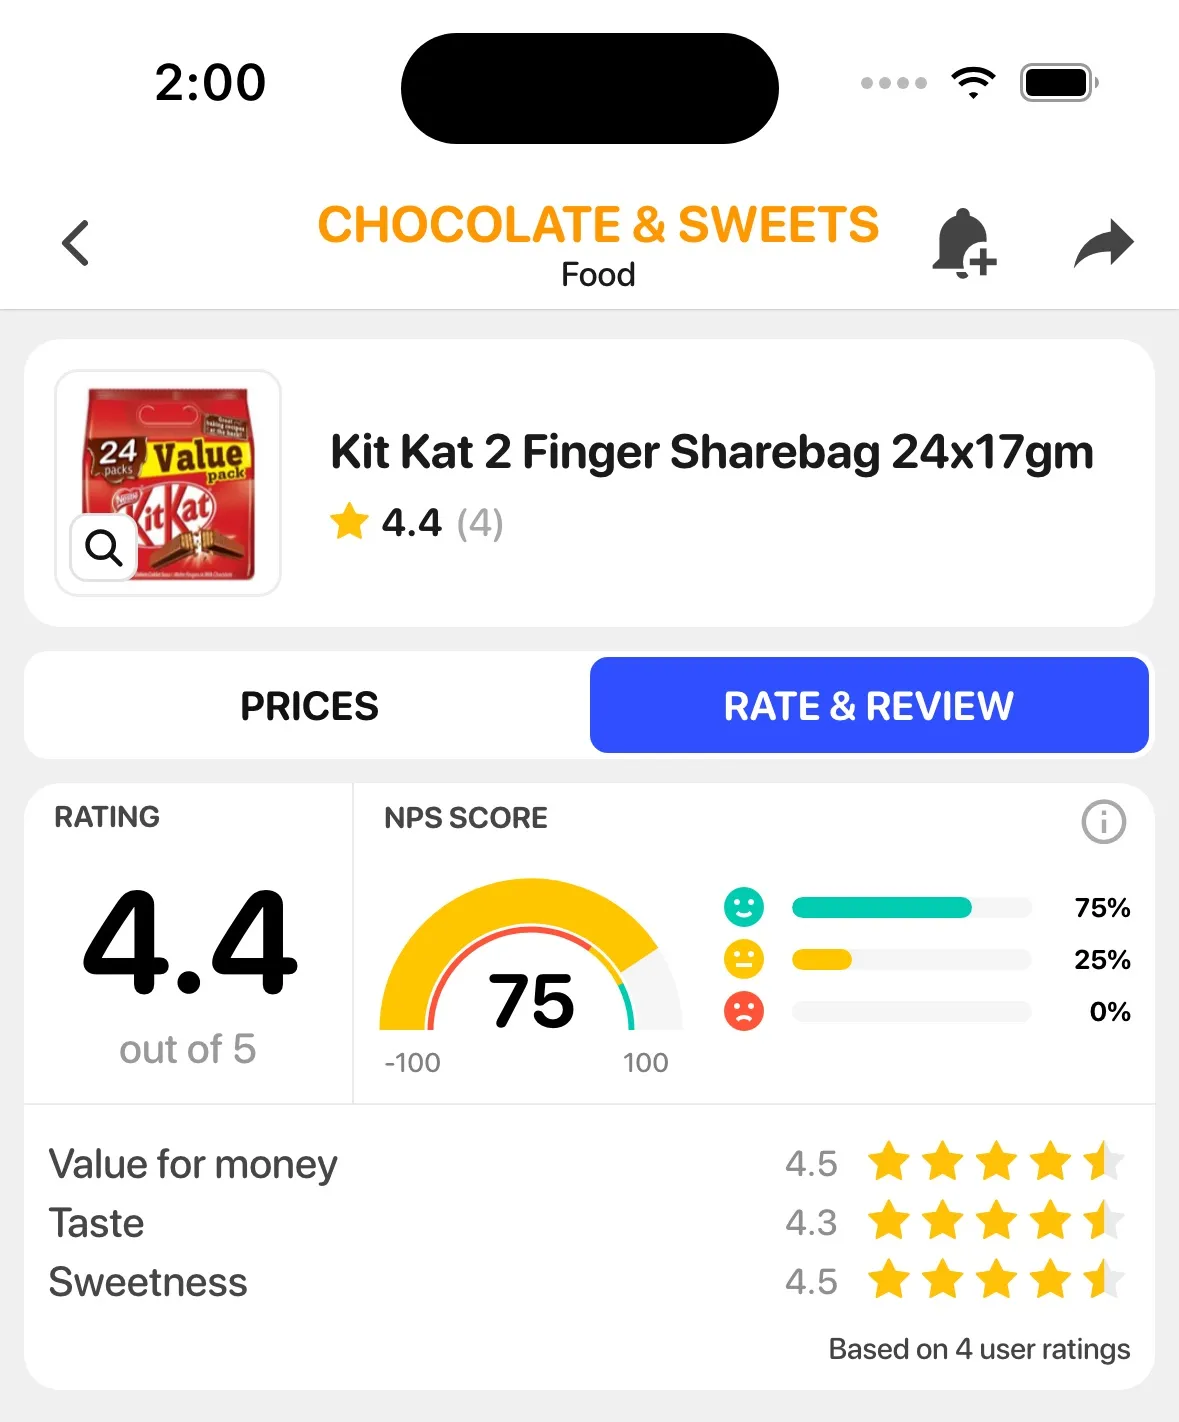
The average rating sits under the product name, with the number of ratings beside it. Below the price graph, the page now has two tabs, Prices and Rate & Review. The second tab only appears in categories where the marketing team has set up the aspects and sentiments, so for now you’ll see it on some products and not others.
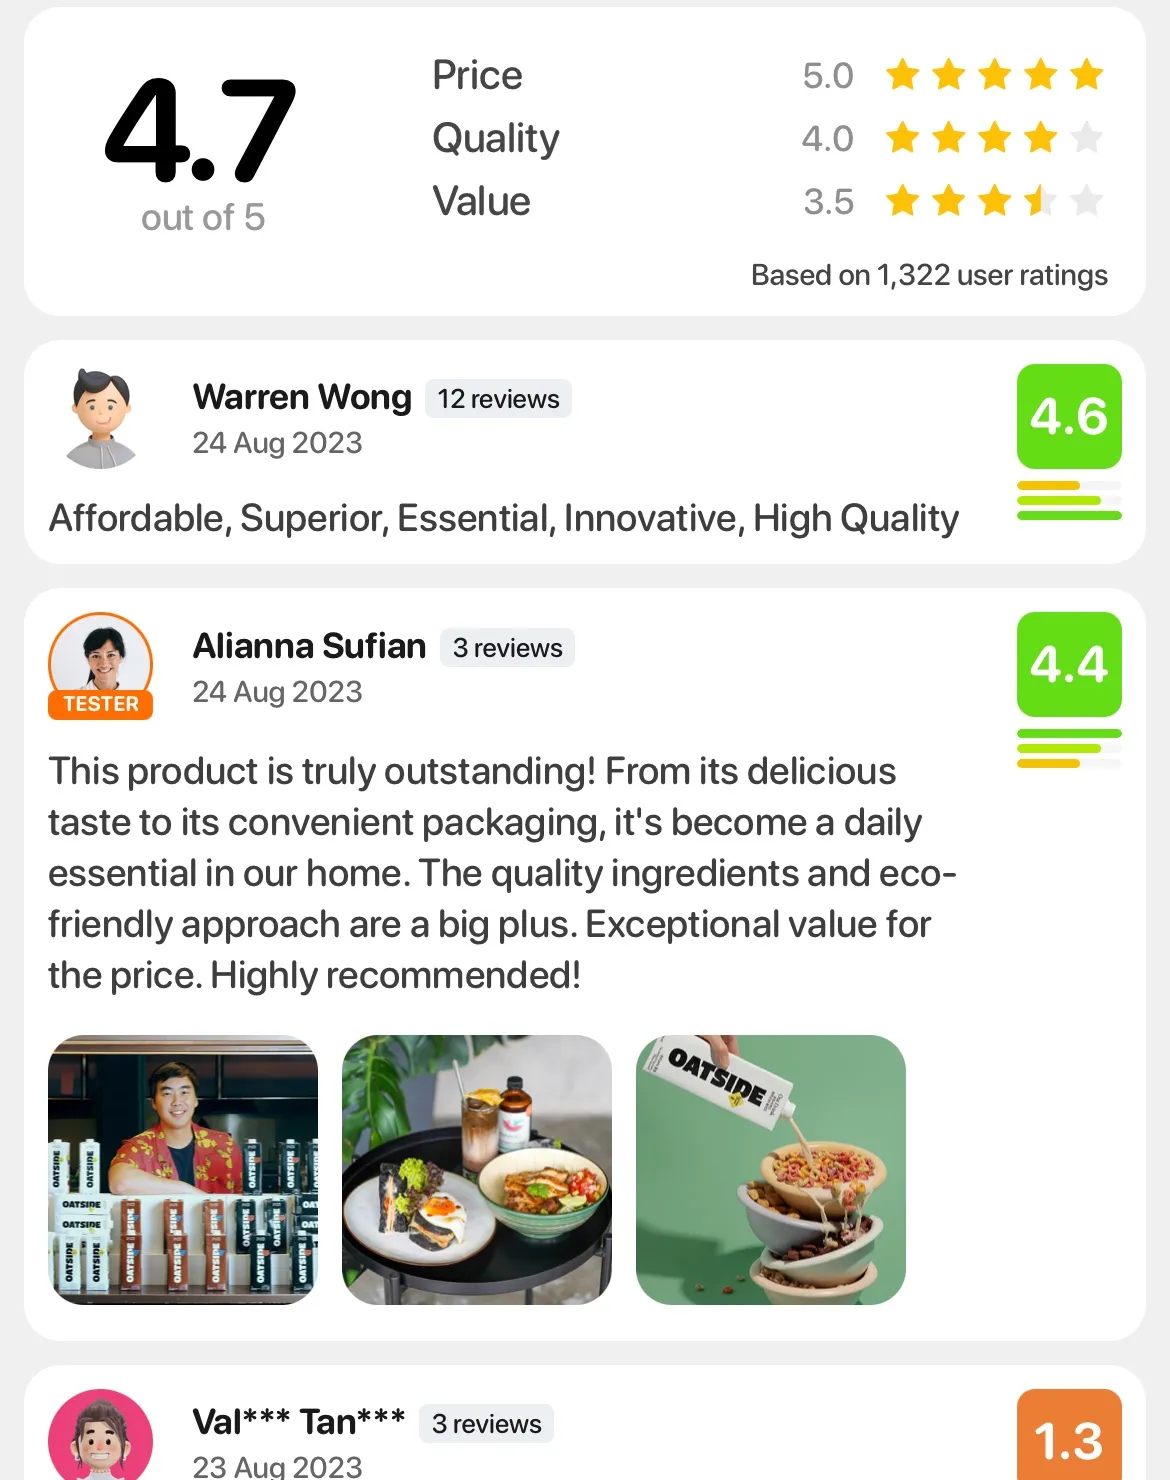
Rate & Review starts with the overall score out of 5 and the average for each aspect. Under that is everyone’s rating. Each one has a score in a coloured box that goes from green down to orange and red, a few short bars under it for the individual aspects, and the sentiments that person picked. I designed these screens and built most of the front end for them, including the star rating, the sentiment picker and the rating card.
The one place you can type
Tester reviews are coming in the next update. Members of our Sample Club get products to try, and for the products they’ve been sent, they’ll be able to write a full review and add photos.
A tester’s rating will have the same stars and score as everyone else’s, plus an orange ring around their picture, a Tester label, and their review underneath. Long reviews get cut at 250 characters with a link to read the rest. Only testers who were sent that product can review it, so it stays a small group.
The recommend question
Star ratings and sentiments weren’t our first attempt at collecting product feedback. Before building those, we’d added a simpler question to the product page: how likely are you to recommend this product to someone else?
It’s the question behind Net Promoter Score, or NPS. We initially treated it as a separate feature, with its own card above the retailer prices.
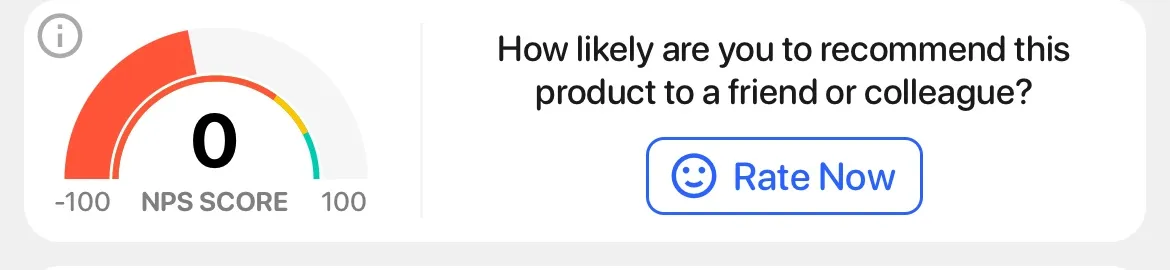
You answer from 1 to 10. Tap Rate Now and the card turns into a row of ten faces, sad on the left and happy on the right. You can tap one, or slide your finger along the row until you get to the one you mean. The app measures where each face sits when the row is laid out, and as your finger moves it picks whichever face is under it.
A 9 or 10 makes you a promoter, a 7 or 8 is passive, and anything from 1 to 6 counts as a detractor. The score is the percentage of promoters minus the percentage of detractors, so it can go anywhere from -100 to 100, and passives don’t count either way. On the card below, 77% of the answers were promoters and 12% were detractors, which gives 65.
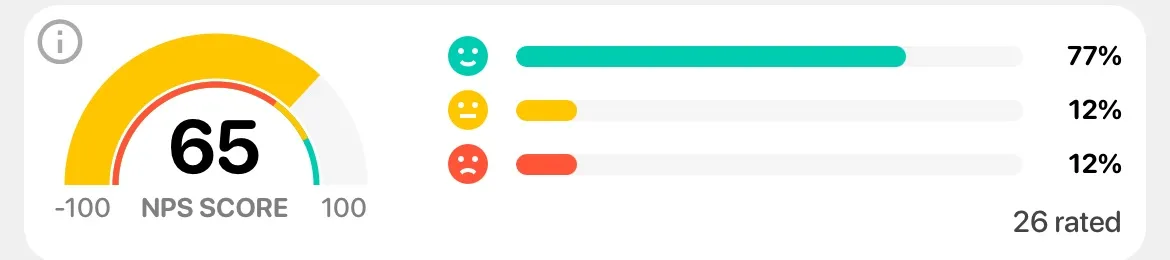
I drew the gauge with d3-shape and react-native-svg. The thick arc fills up to the score and changes colour with it, and the thin arc inside shows where the colour turns from red to yellow to green. There’s an info button in the corner that explains what NPS is and which faces count as what.