The price history graph, and the clamp I forgot
The bar on every Hargapedia product page has been redrawn a few times and is still horizontal, and this is how it is built, along with the classic mistake in the first version.
Every product page in Hargapedia has a small graph near the top. It shows the lowest and highest price we’ve seen for the product over the last few months, the usual price somewhere in between, and where today’s price sits against all of that. It’s one bar with two labels and four numbers on it, and it’s one of the more complex components in the app, and the version that went out this month is the latest in a long line of them.
It has always been a horizontal bar
The first design, from early 2018, already had the shape it has now. A bar from lowest to highest, the usual price marked above it, today’s price marked below it with a line down to the retailer offering it. The wireframes for 2.0 kept the same idea, and that’s what we built.
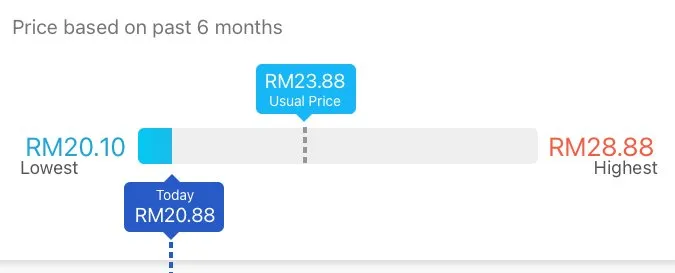
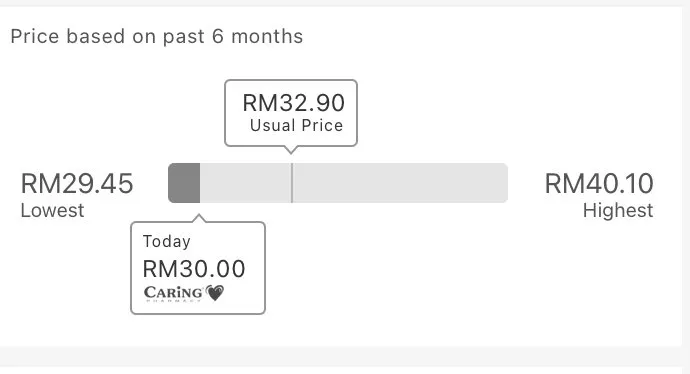
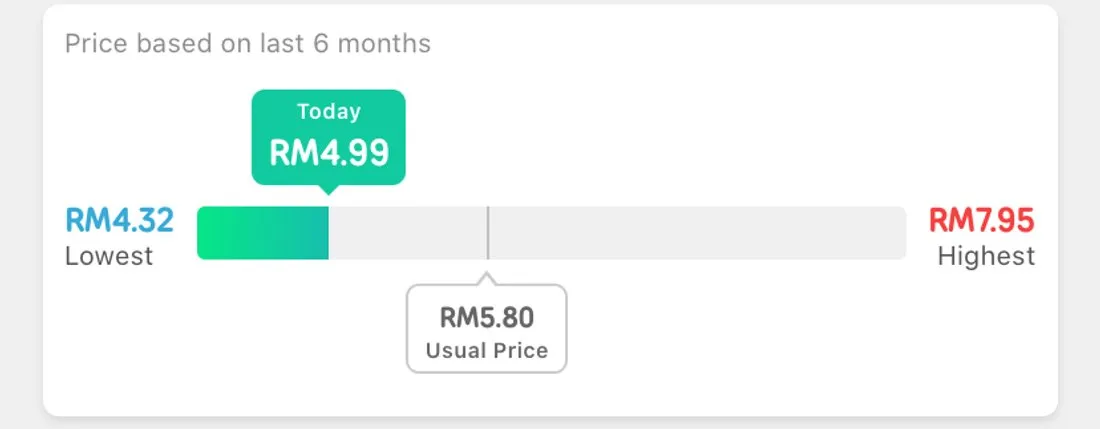
By 2020 it had a green fill from the left edge up to today’s price, so you could read at a glance how close to the lowest you were.
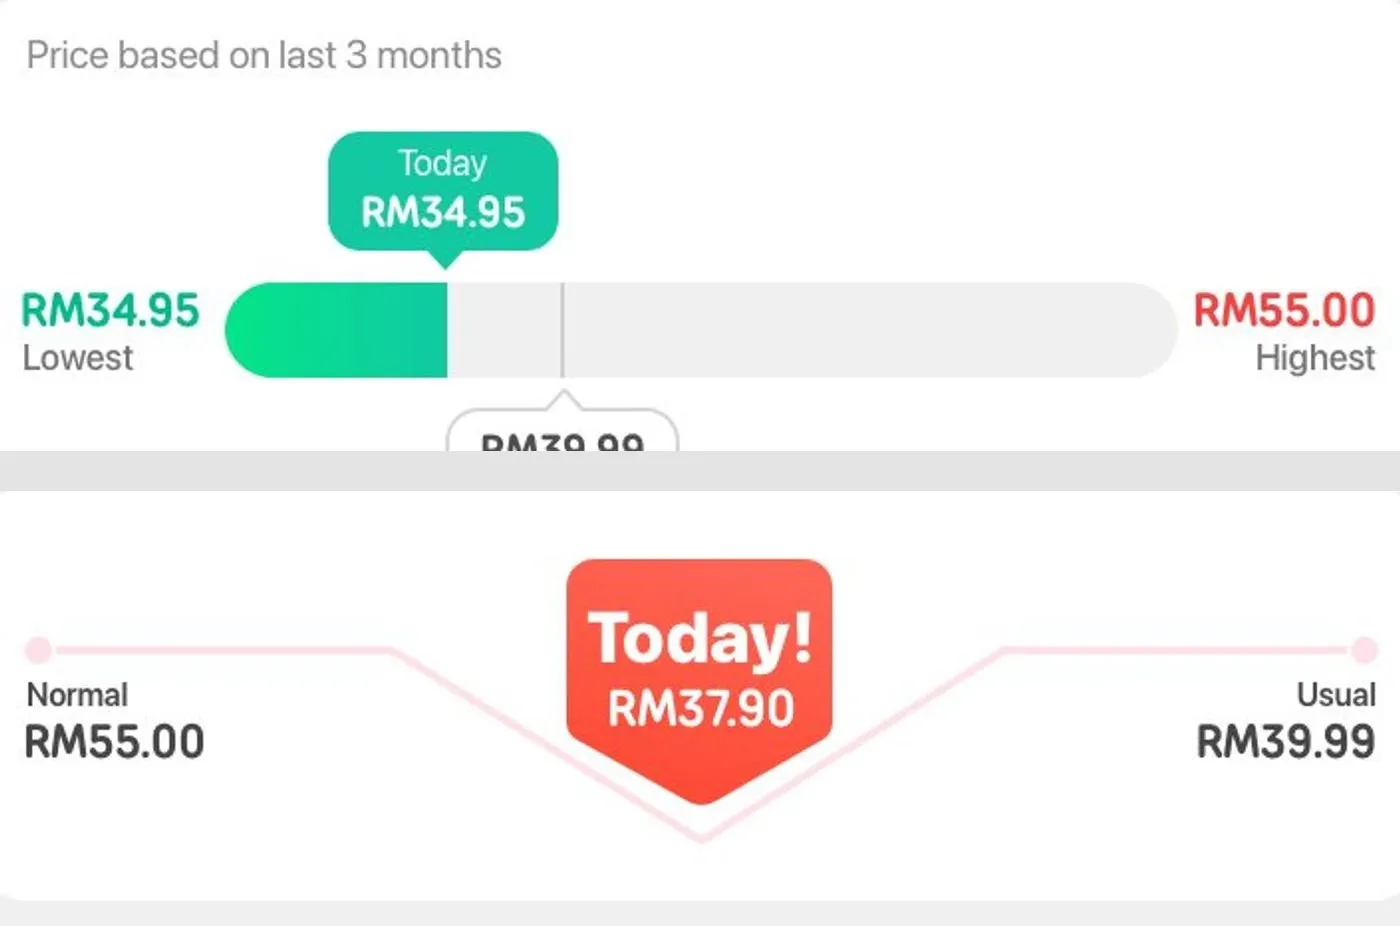
When we redesigned the app for 3.0 I tried something else, a line that dipped from the normal price down to today’s and back up to the usual, with a big Today pin in the middle. It didn’t survive the mockups. The horizontal bar went into 3.0 instead.
This month I had another go, and the mockups had two vertical versions in them, a thin bar standing next to the product photo with the usual price marked on it and today’s price as a tag. They were rejected, and frankly they weren’t appealing. We’re sticking with the horizontal one, with a gradient under the fill and a compact version for the price tracker.
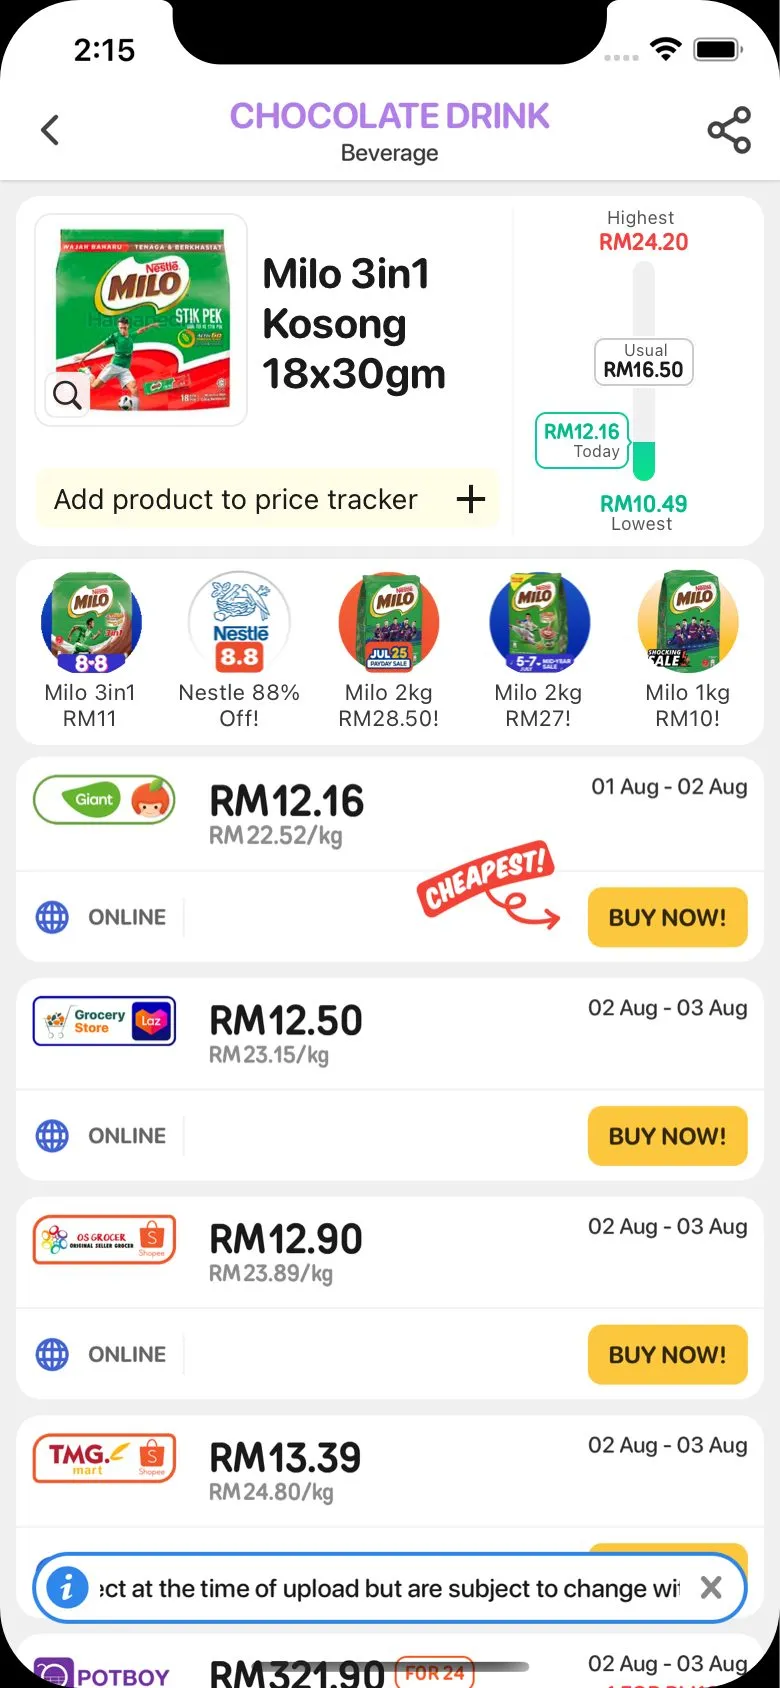
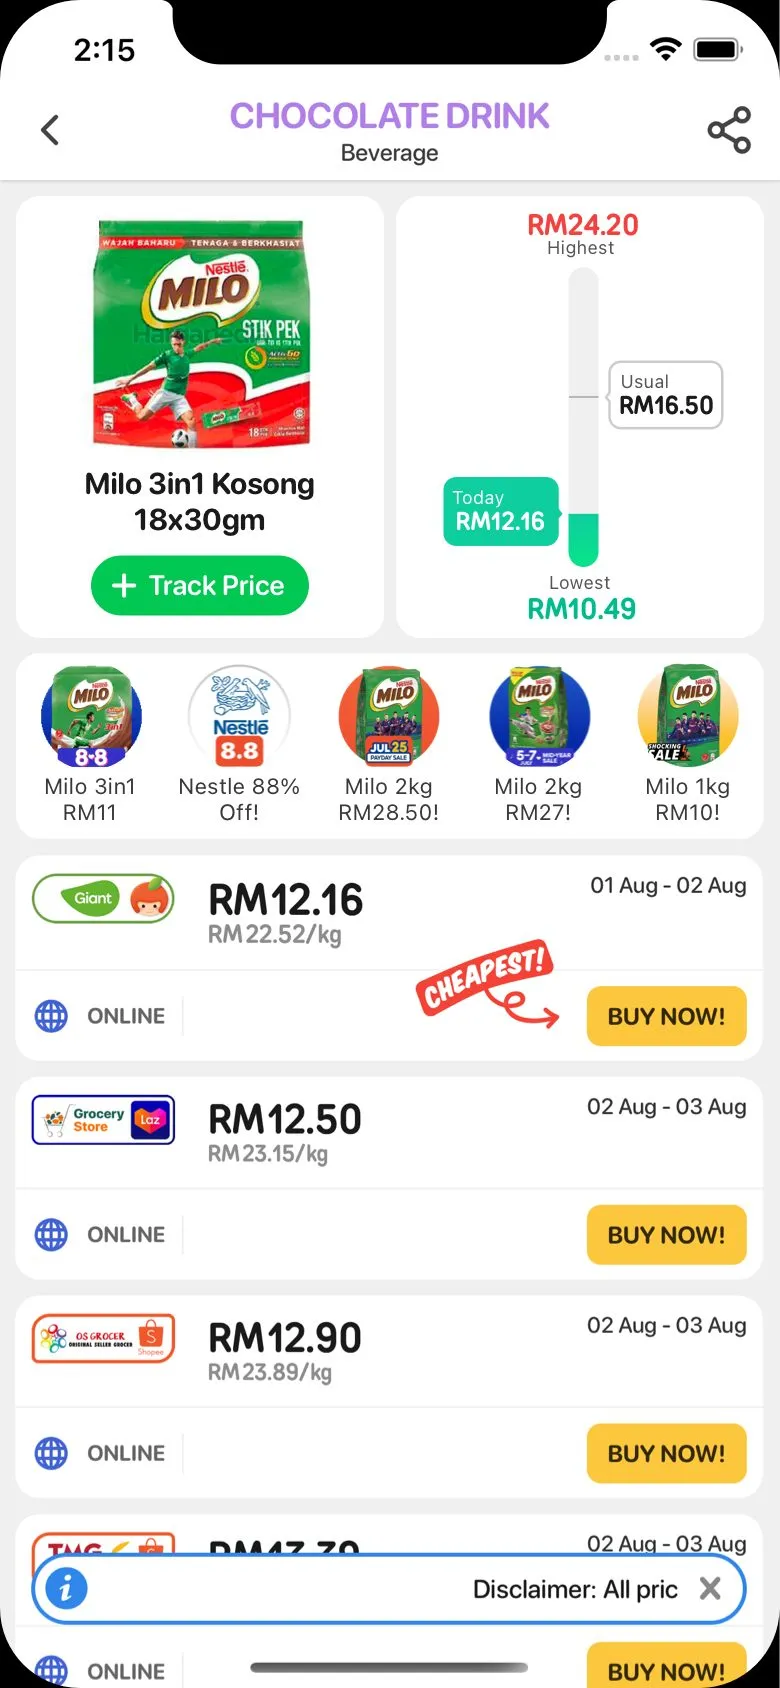
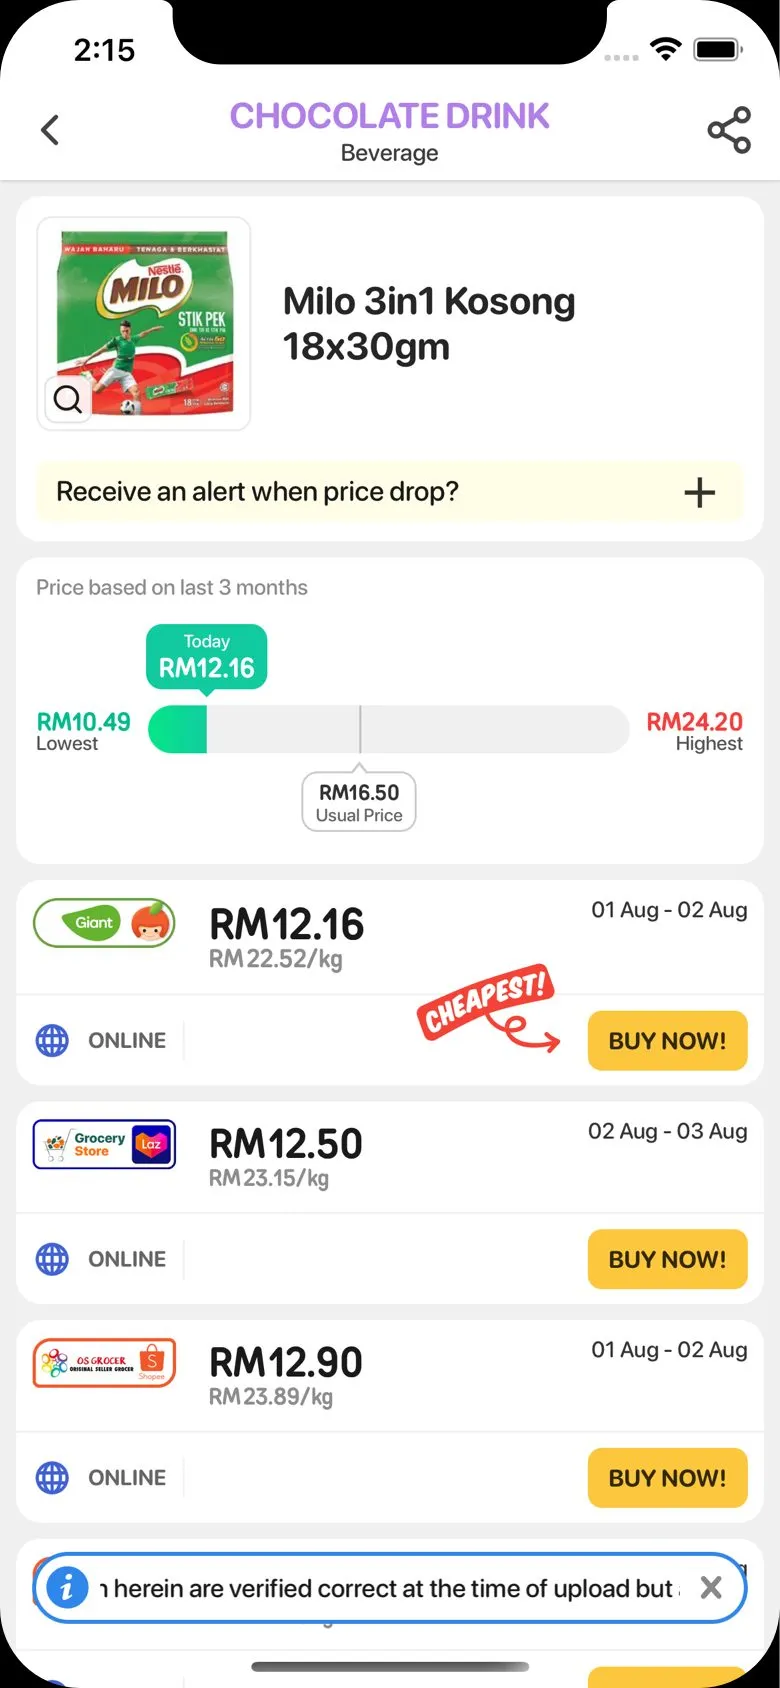
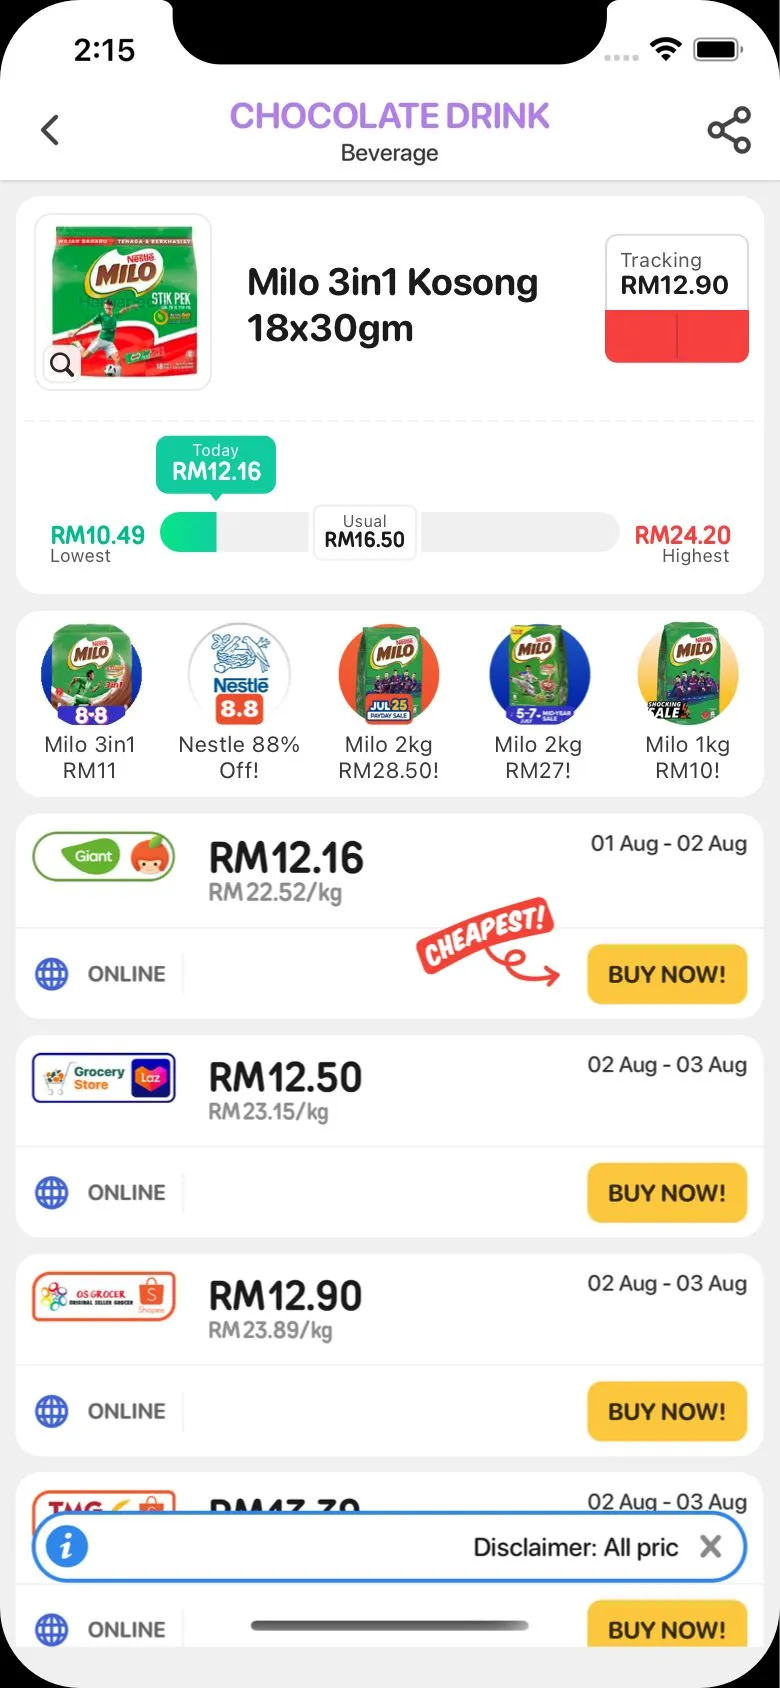
How it’s put together
Everything on the bar is a position along it, worked out from the price range. The component measures the bar and both labels when they lay out, then places each label as a fraction of the bar’s width.
// position along the bar, as a fraction of its measured width
labelPositionUsual =
  ((priceUsual - priceLow) / (priceHigh - priceLow)) * barWidth;
labelPositionToday =
  ((priceToday - priceLow) / (priceHigh - priceLow)) * barWidth;

// center the label on that point
const labelTodayInitial = -this.state.todayLabelWidth / 2;
marginLeft: labelTodayInitial + labelPositionToday
The widths come from onLayout, which means the first render has nothing to go on and the labels jump into place a frame later. The fill is done back to front. The gradient runs the full width underneath, and a grey block covers it from today’s position to the right edge, so the coloured part is whatever is left.
<View style={[styles.barGray, { width: barWidth - labelPositionToday }]} />The today label takes its colour from where it lands, green near the lowest and red near the highest, in ten steps. And the usual price label gets special treatment, because a label centered on a point near either end would hang off the bar. If the usual price is within a few percent of the lowest or the highest, the label snaps to that end instead.
const handleUsualPosition = () => {
  const clampHigh = parseFloat((priceHigh * 0.96).toFixed(2));
  const clampLow = parseFloat((priceLow * 1.04).toFixed(2));

  if (priceLow === priceHigh) return labelUsualInitial + labelPositionUsual;
  if (priceUsual === priceLow || priceUsual < clampLow) return 0;
  if (priceUsual === priceHigh || clampHigh < priceUsual)
    return barWidth - this.state.usualLabelWidth;

  return labelUsualInitial + labelPositionUsual;
};
When the lowest and highest are the same price, everything sits at the halfway mark, otherwise the division above would be by zero.
The clamp I forgot
The first version had a bug that I should have seen coming. The position formula assumes today’s price sits between the lowest and the highest, and most of the time it does, because the summary is built from the same prices. But the summary covers the last few months, and today’s price is today’s. The moment today’s price fell outside that range, the fraction went past zero or past one, and the fill just kept going, off the end of the bar and off the screen. There was nothing stopping it. A very classic mistake.
The fix went into the product screen rather than the graph. If today’s price is lower than the summary’s lowest, today’s price becomes the lowest, and the graph never sees a value outside its own range.
// this checks if the price today happens to be below the lowest
// and replaces the summary lowest so the graph doesn't go off
const valueLowest = valueToday && valueToday < low ? valueToday : low;
That’s where it stands, a horizontal bar measured at runtime, with its labels centered and clamped. The vertical ones are still in the Sketch file.